
You spent $400 on a power meter. You stare at the number on your Garmin. It goes up when you push harder and down when you soft-pedal. Congratulations — you've built the world's most expensive speedometer.
That's not a dig. It's where almost every triathlete starts. Power meters are incredible tools, but like most incredible tools, they only reveal their value when you understand what they're actually measuring. This guide will change that.
Why Power Beats Heart Rate on the Bike
Heart rate is real-time feedback from your cardiovascular system — and it lags. After a hard climb, your HR stays elevated for 30–60 seconds even as the effort drops. On a hot day, cardiac drift means your HR creeps upward just from heat stress, not workload. In the first miles of the bike, adrenaline keeps HR artificially high. By the time it settles, you've already dug a hole you'll spend the run trying to climb out of.
Power is instantaneous. The watt reading on your head unit reflects exactly what you're doing right now, not what you were doing 45 seconds ago. For triathlon pacing — where discipline transitions and variable conditions already make execution hard enough — that immediacy is everything.
That said, HR wins one fight: detecting overreaching during training blocks. If your power output is normal but your HR is 10 bpm higher than usual for that effort, your body is telling you something. That pattern, tracked consistently, is your early warning system for illness, overtraining, and accumulated fatigue.
Use both. Race with power. Train with both. That's the meta.
The 5 Numbers Every Triathlete Needs
1. FTP — Functional Threshold Power
FTP is the maximum average power you can sustain for approximately one hour. It's your anchor number — everything else is calculated relative to it. A standard 20-minute test (take 95% of your average power) gives you a solid estimate without destroying your training week.
For race pacing, most triathletes target 70–80% of FTP for Ironman bike legs and 80–88% for 70.3. Go higher, and the run will collect its debt.
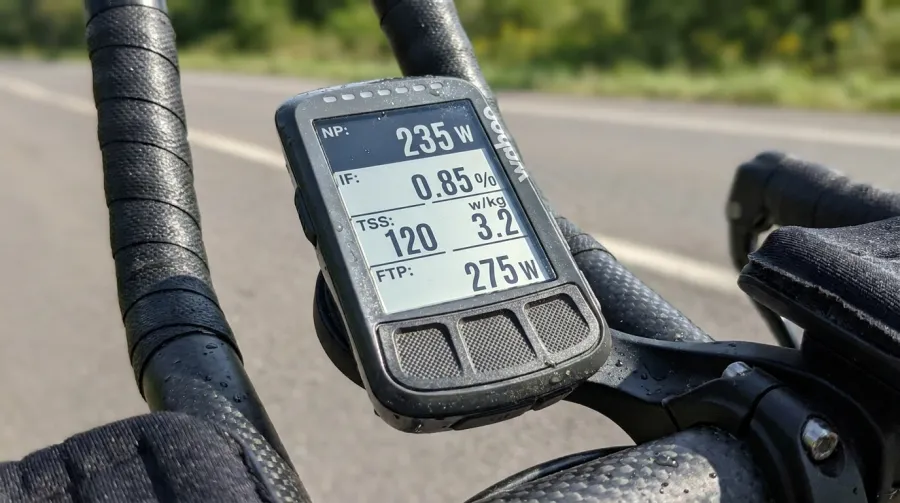
2. Normalized Power (NP)
Real-world rides aren't flat. You surge, coast, climb, sprint. Average power undersells the metabolic cost of that variability. Normalized Power adjusts for it using a weighted algorithm that reflects physiological stress more accurately than a simple mean.
Example: An athlete averaging 180W on a hilly course with lots of surging might have an NP of 210W. The body experienced the effort of 210W sustained, even though the average says otherwise. This matters enormously for race planning on technical or windy courses.
3. Intensity Factor (IF)
IF = Normalized Power ÷ FTP. A value of 0.75 means you rode at 75% of your FTP, accounting for variability. This is your single-number race intensity gauge:
- Ironman bike: 0.68–0.75
- 70.3 bike: 0.78–0.86
- Olympic: 0.85–0.95
If you hit T2 with an IF above your target and your legs feel fine, do not get optimistic. You'll know within the first 3km of the run.
4. Training Stress Score (TSS)
TSS combines duration and intensity into a single fatigue number. An hour at FTP = 100 TSS. An easy 2-hour ride might be 80 TSS. A hard Ironman bike leg might be 260+ TSS.
TSS powers the Chronic Training Load/Acute Training Load model (CTL/ATL) in platforms like TrainingPeaks. Over time, your CTL — your "fitness" — is the rolling 42-day average of daily TSS. Your ATL is the 7-day average — your "fatigue." The difference between them is your Form (or "Freshness"). Race with positive Form. Train in negative Form. That's periodization in a formula.
5. W/kg — Watts Per Kilogram
Raw wattage means nothing without body weight context. A 220W FTP on a 65kg athlete (3.38 W/kg) is a very different rider than a 220W FTP on a 90kg athlete (2.44 W/kg). W/kg is the universal comparative metric.
For reference: competitive age-group triathletes typically range from 2.8–3.8 W/kg FTP. Elite pros sit at 4.5–5.5 W/kg. Knowing your W/kg also predicts your climbing speed more accurately than raw watts — useful for race simulation on hilly courses.
Power Meter Types: What Works for Triathletes
The right power meter type depends on your bike setup, budget, and how many bikes you need to cover.
Pedal-Based
Pedal power meters are the most triathlon-friendly option. They install in minutes, transfer between bikes without tools, and offer dual-sided power measurement. The tradeoff: stack height adds ~10–12mm, which affects aerodynamics slightly on deep TT pedal setups. Also watch cleat compatibility — not all systems support the aero cleats triathletes favor.
Crank Arm (Left-Only vs. Dual)
Crank arm power meters attach a strain gauge directly to the crank arm. Left-only units (like the 4iiii Precision 3) measure left leg power and double it — accurate enough for most athletes but less precise for those with significant leg imbalances. Dual crank arm systems measure both sides independently. Lightweight, low-profile, and frame-friendly.
Spider-Based
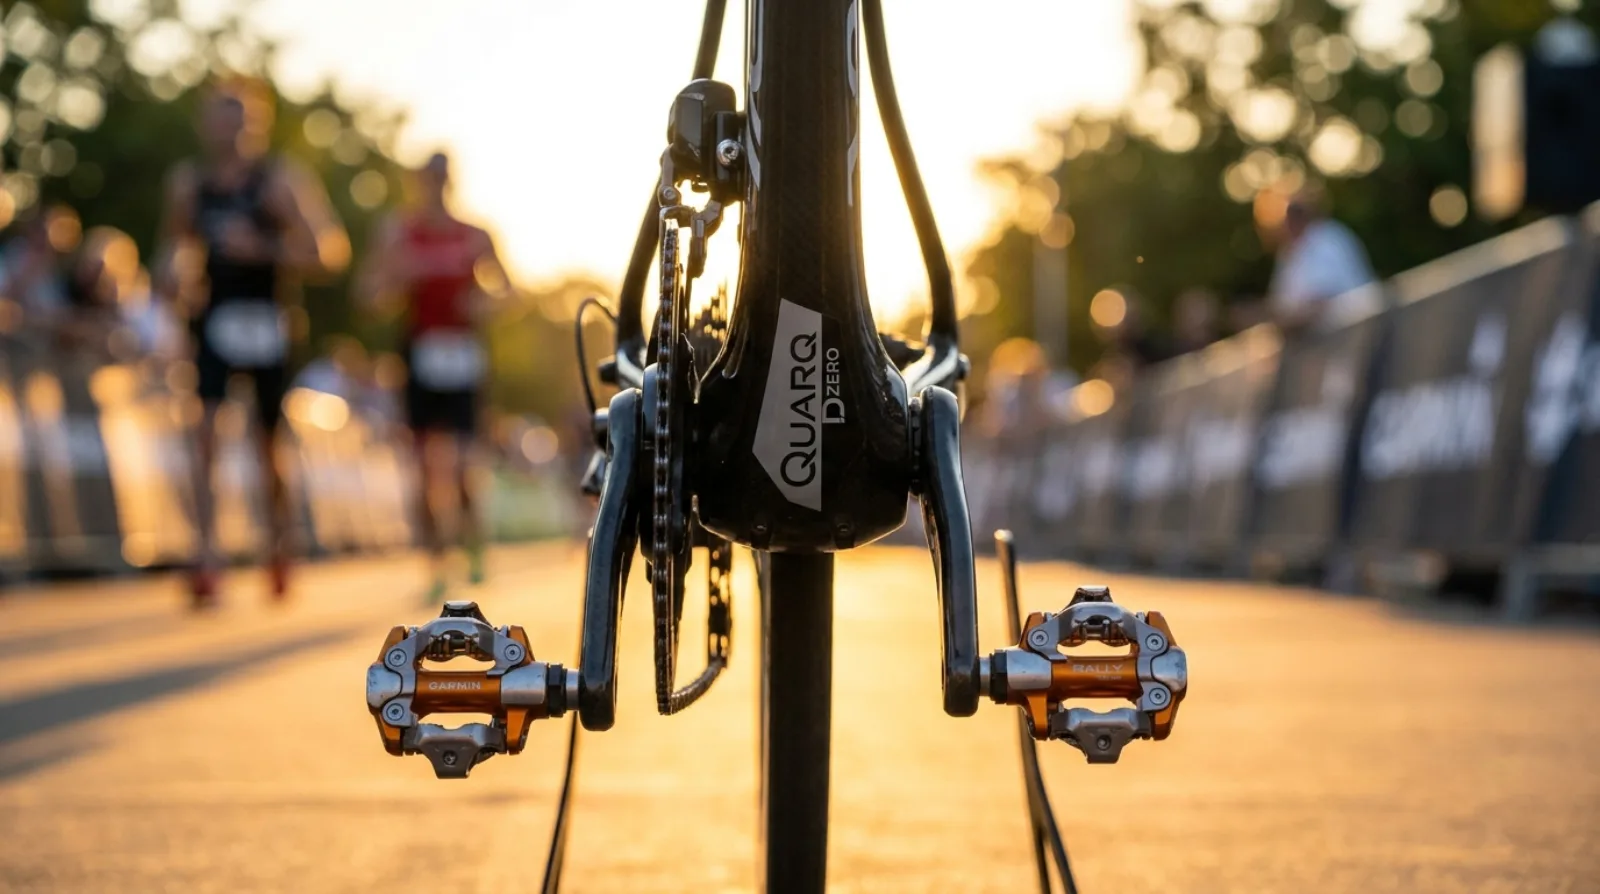
Spider power meters (like the Quarq DZero) live between your chainrings and crankset. They measure total power with high accuracy and minimal moving parts. The catch: they're crankset-specific and don't transfer between bikes easily. Best for dedicated race bikes.
Hub-Based
Rear hub power meters (PowerTap) measure at the wheel rather than the crank, which means they miss drivetrain losses but are highly durable. Less common now, and less ideal for triathlon due to wheel compatibility constraints.
Best Power Meters in 2026 by Budget
Under $350 — 4iiii Precision 3
If budget is the ceiling, the 4iiii Precision 3 is the honest choice. Starting around $300, this left-side crank arm unit installs on your existing Shimano 105/Ultegra/Dura-Ace crankset, adds only 9 grams, and delivers ±1% accuracy with up to 800 hours of battery life on a CR2032. Apple Find My integration is a genuinely useful bonus. The left-only caveat is real, but for athletes without known power imbalances, it's a rounding error.
Around $400 — Quarq DZero
The Quarq DZero spider sits in the $400–$425 range and is the spider-based power meter most commonly found on dedicated triathlon bikes. It measures true total power, handles SRAM cranks and some Specialized setups, and features MagicZero automatic calibration plus 10K temperature compensation. The 200-hour battery life (CR2032) is modest but manageable. Accuracy is ±1.5% — slightly below the pedal-based leaders but consistent in the field.
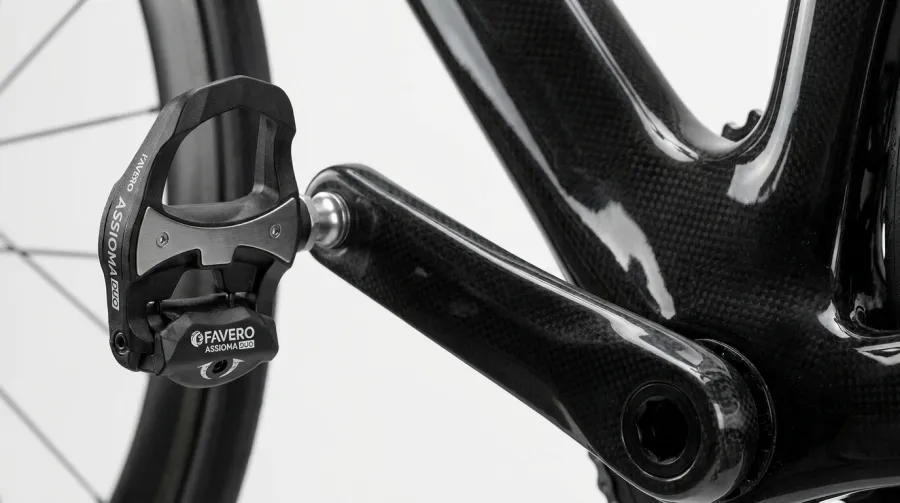
Around $700 — Favero Assioma Duo
The Favero Assioma Duo is the performance-per-dollar king at its price point (~$699). Dual-sided measurement, ±1% accuracy, 50+ hours on a rechargeable battery (USB-C), LOOK Kéo cleat compatibility, and a 54mm Q-factor that works on most triathlon setups. The IAV power algorithm handles oval chainrings without drama — a small but meaningful detail for athletes running oval rings on their TT bikes. Transfers between bikes in under two minutes. For most triathletes, this is the answer.
$1,100+ — Garmin Rally RS200 / RK200
The Garmin Rally RS200 (Shimano SPD-SL) and RK200 (LOOK Kéo) both retail at $1,099. You're paying for deep Garmin ecosystem integration — seamless syncing to Garmin Connect, in-depth cycling dynamics (power phase, platform center offset, seated/standing detection), and the ability to swap spindles between pedal bodies as your cleat preference evolves. Battery life is exceptional at 120 hours using LR44 batteries, and IPX7 waterproofing handles anything. If you're in the Garmin ecosystem and want the premium experience, the Rally delivers. For athletes who don't need the ecosystem lock-in, the Assioma Duo provides 95% of the value at 60% of the price.
How to Use Your Power Meter on Race Day
All this theory means nothing if you leave T1 and immediately hammer the first hill because you feel great. You'll feel great for exactly 45 minutes. Then you won't feel great at all.
Pre-race: Know your target IF based on race distance. Program a data screen showing current power, 3-second average power, and NP. The 3-second average smooths momentary spikes without lag; NP keeps you honest over the full ride.
First 20 minutes: Ride conservatively, even when the crowd or course pulls you harder. Your glycogen stores are full, adrenaline is running, and every watt you spend above target here is a watt borrowed against your run.
Mid-race: Watch NP against your IF target. Hilly courses will naturally push NP above average — that's expected. But if your NP is 10% over target, your IF has drifted and you need to back off, regardless of how the legs feel.
Final 10km: This is where athletes with proper pacing actually have power left to use. If you've hit your IF targets, you can increase effort without gambling. If you haven't, you already know why the run is going to hurt.
Start Here
You don't need to master all five numbers at once. Start with FTP — get a solid test, note the number, and build a power target for your next race based on distance. Then add NP and IF into your race-day data fields and watch how they behave. TSS and CTL/ATL become useful once you're logging consistent training and want to plan periodization.
The power meter doesn't make you faster. Knowing how to read it does.


